1

I just noticed that basic data such as historical Gross Domestic Product (GDP) at market prices in local currency differs between the World Bank (WB) and the OECD. For instance, for Canada between 2010 and 2013:

WB   : 1,662,757,000,000  1,760,011,000,000  1,819,967,000,000  1,881,200,000,000
OECD : 1.66276E+12        1.77001E+12        1.83123E+12        1.89376E+12

Or France:

WB   :          1,998,481,000,000   2,059,284,000,000   2,091,059,000,000   2,113,687,000,000
OECD :          1.99711E+12         2.05812E+12         2.08639E+12         2.11789E+12
[OECD]/[WB]-1 : N/A                 -0.06%              -0.22%              +0.20%

Sources: WB and OECD.

The differences are not huge, but for data that has presumably been sourced straight from national statistical institutions with no inflation correction, I'm still surprised. Also, the WB site mentions for its sources: "World Bank national accounts data, and OECD National Accounts data files."

Figures for GDP growth (real) in France in 2013 then differ by 46bp (OECD: 0.74%, WB: 0.29%) (42bp are explained by the difference in current GDP figures, the other 4bp come from differences in GDP deflator data), which is rather material.

Is anyone familiar enough with these 2 institutions' data collection methodologies to explain where these differences come from?


Edit: Just for fun, I have downloaded the data for France from the "official" sources (INSEE, and Eurostat which gets its data from INSEE) and here is the result:

For GDP at current (market) prices:

         2010        2011        2012        2013
INSEE    1,998.5     2,059.3     2,086.9     2,116.6 
Eurostat 1,998.5     2,059.3     2,086.9     2,116.6 
OECD     1,997.1     2,058.1     2,086.4     2,117.9 
WB       1,998.5     2,059.3     2,091.1     2,113.7 

And for real GDP growth:

         2010    2011    2012    2013
INSEE    2.0     2.1     0.2     0.7 
Eurostat 2.0     2.1     0.2     0.7 
OECD     1.88    2.09    0.21    0.75 
WB       1.97    2.08    0.33    0.29 

That's quite depressing ...

5
  • 1
    Just in case: A de-facto standard for sourcing GDP numbers is Penn World Table (eg rug.nl/research/ggdc/data/pwt ). So, though your finding is interesting, maybe you should switch to this source. Commented Jun 9, 2015 at 21:07
  • 1
    I do not agree with your recommendation. Wether to use the PWT realky depends on the purpose of the analysis. In the present context I see two peoblems. First of all the question is about nominal GDP at current market prices expressed in national currency. That's something the PWT does not have. Second, the PWT are based on calculations made on primary data. This makes a comparison with other sources (OECD, WB, national sources, ... ) even more difficult. Commented Jun 10, 2015 at 5:30
  • Just to make clear: I have nothing for or against PWT. I only think that they are not a panacea. Especially not here. Commented Jun 10, 2015 at 5:32
  • @AndréPeseur From PWT7.1 : variable xrat double %10.0g Exchange Rate to US$. So, you may have nominal GDP in PWT. Commented Jun 10, 2015 at 14:46
  • But why use the detour if you can have it directly? And do the PWT rates have the latest data? Commented Jun 10, 2015 at 14:48

1 Answer 1

1

I have just checked the OECD's Statistics database, and I find the following GDP figures for France:

enter image description here

The output approach figures from the OECD match those of the INSEE and Eurostat.

The figures that you attribute to the World Bank correspond to the figures that the OECD obtains by using the income and expenditure approaches. The three approaches are explained by the OECD.

The OECD figures that I have found are in line with those from INSEE and Eurostat. You should know that national accounts are regularly revised. In such a case, international organisations, such as Eurostat, the OECD or the Worldbank update their databases, but it may take some time. And they possibly only due it at certain fixed dates and not all at the same time. Thus, figures from different sources can temporarily get out of sync.

In short, there is nothing to be depressed about. You just need to update you data. That's it. And anyway, the differences are really small.

Edit:

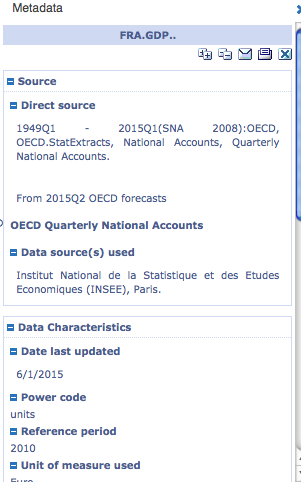
Nevertheless, I suspect that in your case there is yet another explanation. According to your references, you are using data from the OECD's Economic Outlook. These data are displayed as annual data. However, a glance at the metadata reveals that the underlying data are not "genuine" annual data, but come from quarterly national accounts and are aggregated to annual data:

enter image description here

2
  • 1
    Hi André, that's a very good catch. I thought about the different approaches too, but the 3 approaches match in INSEE's present data (imgur.com/4v6M7zG) -- and they match with the "output approach" in your OECD data. I also thought about revisions and lags in updates, but it was just weird that WB's data would be correct for 2010-2011 and OECD's data would be almost correct for 2012-2013... It seems that lags in updates plus the nature of OECD's data make a plausible explanation. Commented Jun 10, 2015 at 6:37
  • 1
    PS: it's true that the differences are very small, and probably within the margin of error of the aggregates. It's just that I had not realized yet that with GDP growths very close to zero, the point estimate for GDP_growth lies within 0+/- margin_of_error. Commented Jun 10, 2015 at 6:46

Your Answer

By clicking “Post Your Answer”, you agree to our terms of service and acknowledge you have read our privacy policy.

Not the answer you're looking for? Browse other questions tagged or ask your own question.