I'm posting here the results of my analysis so far. If this is not an appropriate place for this, let me know. The actual answer to my question is here, where you can find a very large database of mostly German players, with some international ones.
My analysis follows closely the analysis done in this paper, with a few tweaks that I'll discuss as needed.
First, we filter the data set. This data set has 2 ratings listed: FIDE and DWZ. These are very closely correlated, being equal for most players but the DWZ rating system has more entries and so we will use that one for the sake of data quality. Removing players without ratings leaves 68232 men and 4453 women. We then plot the full rating distribution, just to see what it looks like.
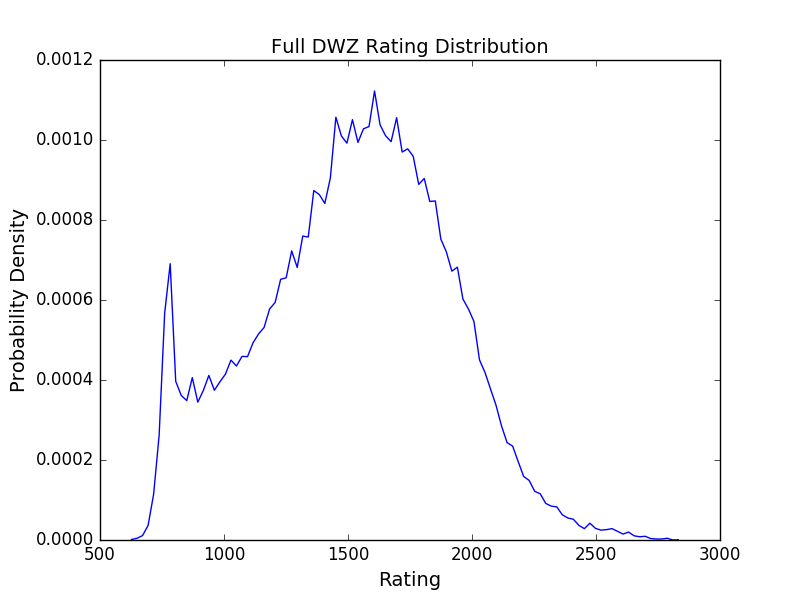
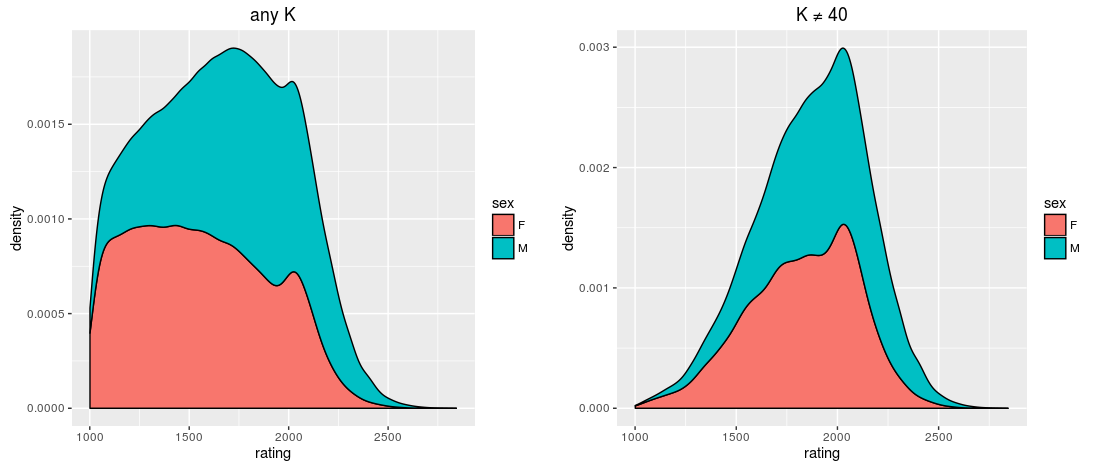
This appears to me more or less Gaussian at the high end, but has some wierd stuff happening at the low end. To find out what's going on there, we plot a heatmap of rating vs age, which clearly shows a bimodal distribution:
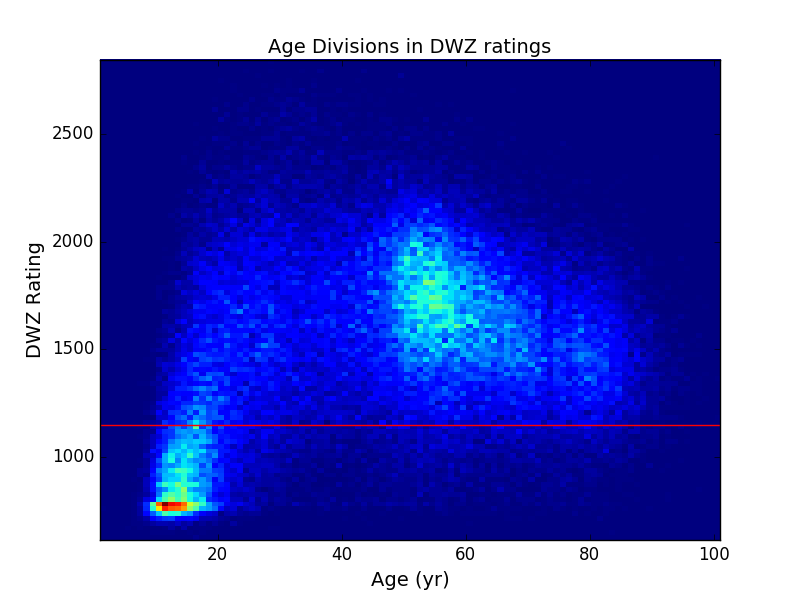
Since the strange peak at the low end appears to come predominantly from youth chess, we will ignore it in subsequent analysis, and remove any players from the dataset with a rating less than 1150 (the red line on the heatmap).
Finally, we filter out all international players and focus only on the German population, since this is the dominant population in the data set. Our final data set contains 51529 men and 2276 women, for a gender ratio of about 23:1.
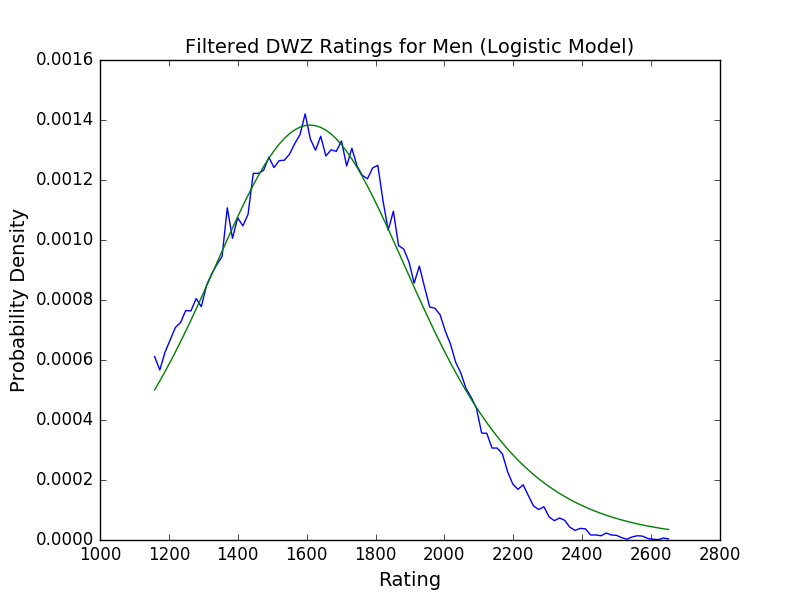
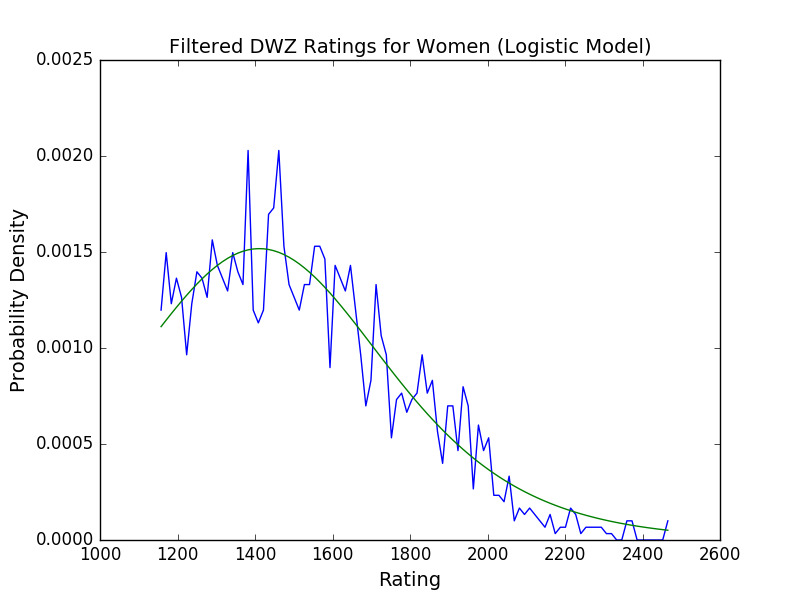
The ratings distributions for men and women separately are shown below, along with Gaussian fits.
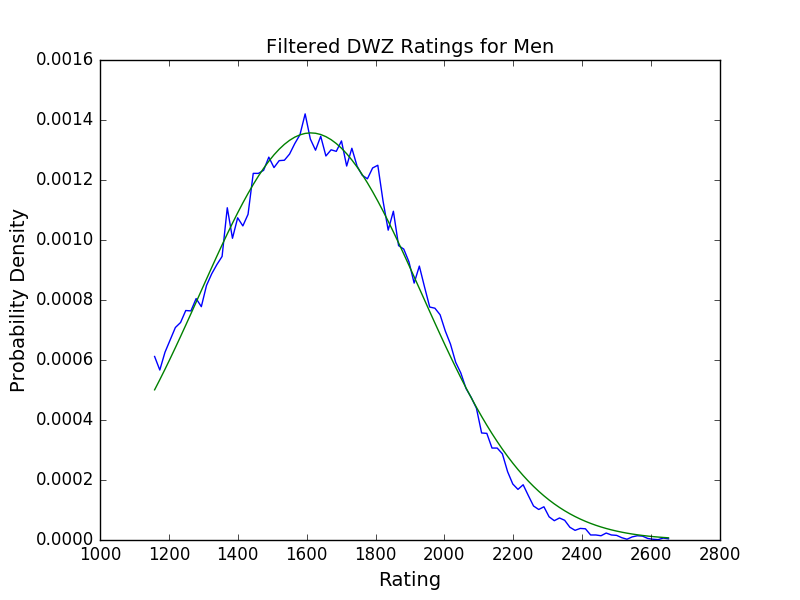
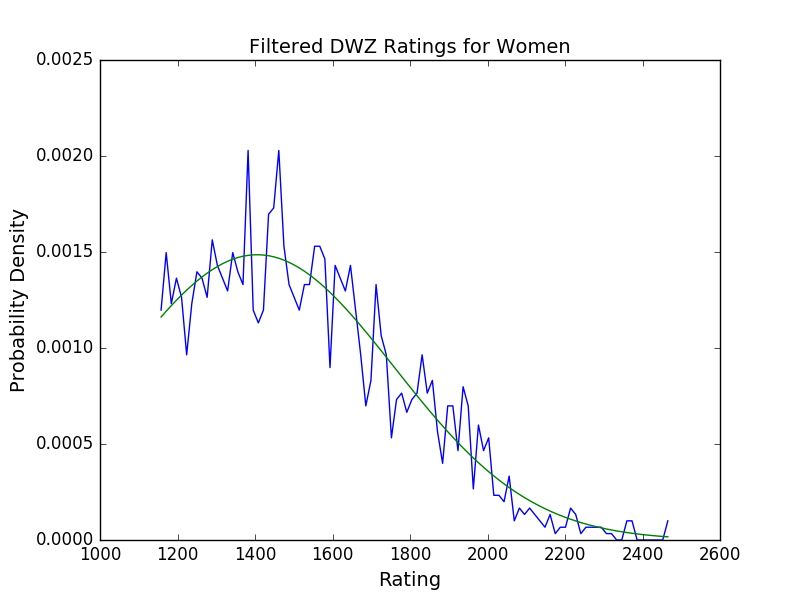
We find that the mean and standard deviation for the men are 1612 and 321, compared to 1406 and 353 for women. We'll revisit this difference later.
We now attempt to determine the effect of sample size on the top 100 players in each population. To do this, we assume as our null hypothesis that the underlying distribution for men and women is the same, and equal to the male population, and we consider the expected difference in ratings between the top 100 pairs from each population. This assumption is generous to the counter argument that there really is a difference between the two populations: if we draw samples for the men from the male population and samples for women from the women's population our expected ratings differences will be much larger than if we draw both samples from the male population.
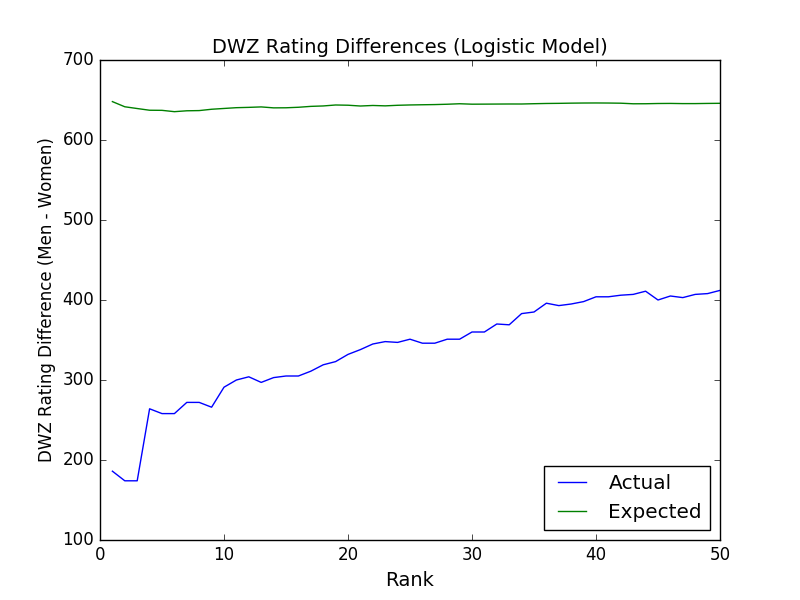
We bootstrap some data by drawing 51529 random samples to represent a realization of male chess players, and 2276 samples to represent the women. From each population we take the 100 best samples, and consider the pairwise differences between them. We then average this over 1000 realizations of this process. The results are plotted below.
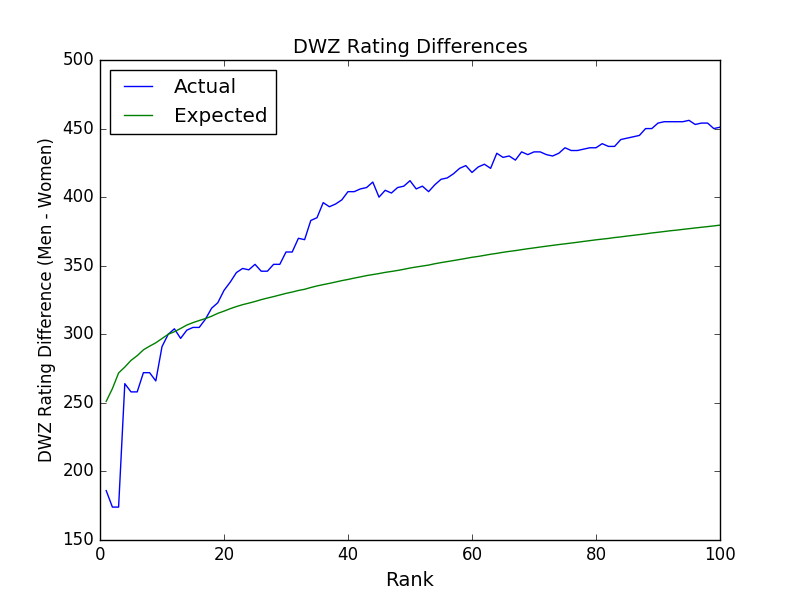
From his analysis, it seems that the top 20 or so female players are actually performing better than one would expect based on sample size differences. From this I'm comfortable concluding that there isn't anything biological at play, and that the differences between the top male and female chess players can be explained by sample size issues.
As to why there is a small difference in the mean between male and female players in the full population, I can't really go on statistics anymore. Clearly there is some selection bias against women in general because of the 23:1 sex ratio, but it's difficult to say exactly why. A possible clue lies in the first plot in the accepted answer, which shows that in the FIDE database, there is a dip in the female probability density around 1800-1900 which is not present in the male population. This suggests that women who are almost, but not quite master-level are more likely to drop out than their male counterparts, which would have the effect of suppressing the mean when considering the full population, but which would only have minimal effect, if any, on the top 100 players, consistent with the approximate skill parity we see there.
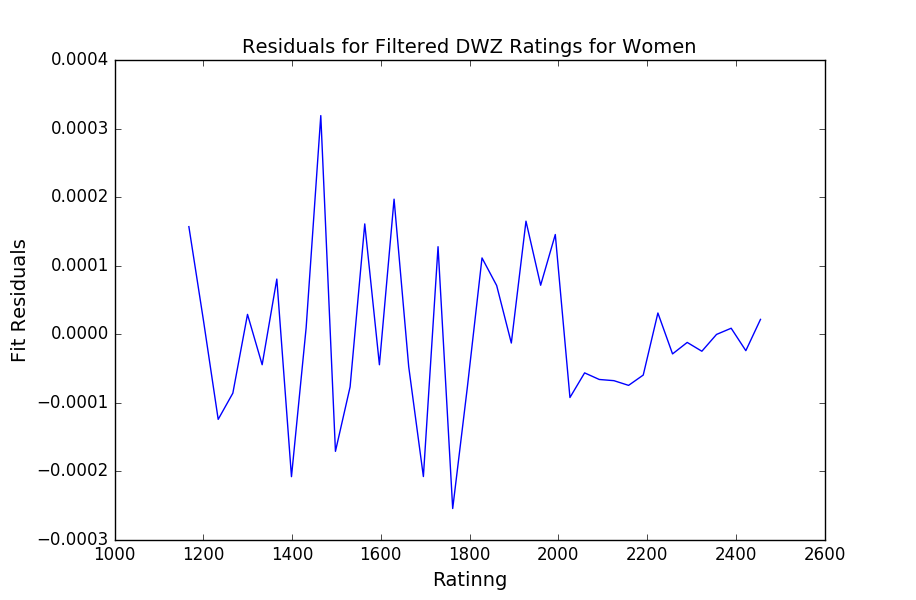
The drop in female players in not as evident in the German DWZ data. If we look at the fit residuals for the female distribution it's pretty even across the whole range. We do see a small dip between 2000 and 2200 where the fit overestimates the density consistently, but it's not enough to explain the difference by itself. That said, the difference is only about half a standard deviation, so it's not hard to argue that it is insignificant. to be begin with.
Why female players in this range drop out is a question for FIDE.
EDIT: in the comments it was pointed out that rating distributions are usually logistic. Below, I show the same plots, but with logistics fits. The data here doesn't support logistic fits very well, as the fit severely overestimates the high-rating tail of the distribution when using a logistic model. As was pointed out, there are likely a sum of a few distributions going into these things, which comes out approximately normal. Further data stratification might be necessary to get logistic fits working.
