"Data visualization" is a wide spectrum -- from tables to infographics, and everything in between.
But I did find one possible source: https://help.plot.ly/json-chart-schema/
The Plotly JSON visualization schema is a complete declarative format for creating, saving, and sharing interactive, scientific charts. The advantage of saving charts as JSON is portability - charts can be shared across any language or platform that understands the schema.
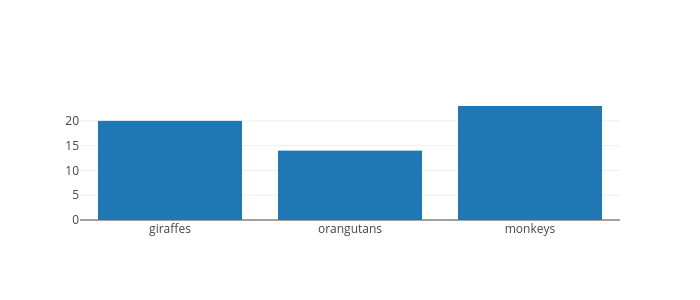
and an example:
{
    "data": [
        {
            "x": [
                "giraffes",
                "orangutans",
                "monkeys"
            ],
            "y": [
                20,
                14,
                23
            ],
            "type": "bar"
        }
    ]
}

The complete JSON schema is maintained as part of Plotly’s V2 REST API:
Fully formatted JSON chart schema for every chart type: https://api.plot.ly/v2/plot-schema?sha1=%27%27
Raw JSON (plain text) chart schema for every chart type: https://api.plot.ly/v2/plot-schema?format=json&sha1=%27%27
This page doesn't have license info, but plot.ly the company states this for plotly.js
Is Plotly.js Free?
Yes. Plotly.js is free and open-source software, licensed under the MIT license. It costs nothing to install and use. You can view the source, report issues or contribute using our Github repository.
https://plot.ly/javascript/is-plotly-free/
