spelling
Source Link
eigenvector
  • 592
  • 2
  • 19

I would like to see some ready-made sources for 2016 CBSA-level data. Until then, I suggest using county-level sources and aggregating them to CSBACBSA-level. For this, you can combine cross-walks listed in your link or, possibly easier, use this cross-walk from Jean Roth provided at NBER. Given the excellent .csv and .dta files the aggregation should be straightforward.

As for data: For the county-level, the American FactFinder provides a promising compilation. I found very detailed 2016 data on several of the topics you requested. Two examples:

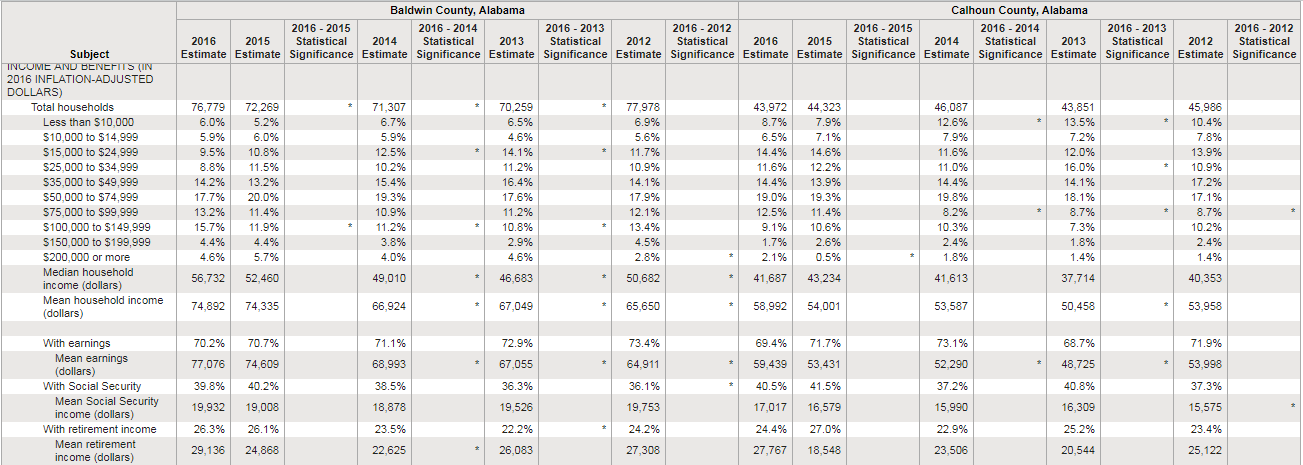
Comparative Economic Characteristics (Source ID CP03, ACS 1 year survey 2016) enter image description here with, for example, the income distribution as well as mean and median income.
Unemployment (Source ID S2301, ACS 1 year survey 2016) enter image description here with unemployment rates split by age group.

I would like to see some ready-made sources for 2016 CBSA-level data. Until then, I suggest using county-level sources and aggregating them to CSBA-level. For this, you can combine cross-walks listed in your link or, possibly easier, use this cross-walk from Jean Roth provided at NBER. Given the excellent .csv and .dta files the aggregation should be straightforward.

As for data: For the county-level, the American FactFinder provides a promising compilation. I found very detailed 2016 data on several of the topics you requested. Two examples:

Comparative Economic Characteristics (Source ID CP03, ACS 1 year survey 2016) enter image description here with, for example, the income distribution as well as mean and median income.

Unemployment (Source ID S2301, ACS 1 year survey 2016) enter image description here with unemployment rates split by age group.

I would like to see some ready-made sources for 2016 CBSA-level data. Until then, I suggest using county-level sources and aggregating them to CBSA-level. For this, you can combine cross-walks listed in your link or, possibly easier, use this cross-walk from Jean Roth provided at NBER. Given the excellent .csv and .dta files the aggregation should be straightforward.

As for data: For the county-level, the American FactFinder provides a promising compilation. I found very detailed 2016 data on several of the topics you requested. Two examples:

Comparative Economic Characteristics (Source ID CP03, ACS 1 year survey 2016) enter image description here with, for example, the income distribution as well as mean and median income.

Unemployment (Source ID S2301, ACS 1 year survey 2016) enter image description here with unemployment rates split by age group.

added 84 characters in body
Source Link
eigenvector
  • 592
  • 2
  • 19

I would like to see some dataready-made sources for 2016 CBSA-level data. Until then, I suggest using the following county-level sources and aggregating them to CSBA-level. For this, you can combine cross-walks listed in your link or, possibly more straightforwardeasier, use this cross-walk from Jean Roth provided at NBER. Given the excellent .csv and .dta files the aggregation should be straightforward.

As for data: For the county-level, the American FactFinder provides a promising compilation. I found very detailed 2016 data on several of the topics you requested. Two examples:

Comparative Economic Characteristics (Source ID CP03, ACS 1 year survey 2016) enter image description here with, for example, the income distribution as well as mean and median income.

Unemployment (Source ID S2301, ACS 1 year survey 2016) enter image description here with unemployment rates split by age group.

I would like to see some data sources for CBSA-level. Until then, I suggest using the following county-level sources and aggregating them to CSBA-level. For this, you can combine cross-walks listed in your link or, possibly more straightforward, use this cross-walk from Jean Roth provided at NBER.

For the county-level, the American FactFinder provides a promising compilation. I found very detailed 2016 data on several of the topics you requested. Two examples:

Comparative Economic Characteristics (Source ID CP03, ACS 1 year survey 2016) enter image description here with, for example, the income distribution as well as mean and median income.

Unemployment (Source ID S2301, ACS 1 year survey 2016) enter image description here with unemployment rates split by age group.

I would like to see some ready-made sources for 2016 CBSA-level data. Until then, I suggest using county-level sources and aggregating them to CSBA-level. For this, you can combine cross-walks listed in your link or, possibly easier, use this cross-walk from Jean Roth provided at NBER. Given the excellent .csv and .dta files the aggregation should be straightforward.

As for data: For the county-level, the American FactFinder provides a promising compilation. I found very detailed 2016 data on several of the topics you requested. Two examples:

Comparative Economic Characteristics (Source ID CP03, ACS 1 year survey 2016) enter image description here with, for example, the income distribution as well as mean and median income.

Unemployment (Source ID S2301, ACS 1 year survey 2016) enter image description here with unemployment rates split by age group.

Source Link
eigenvector
  • 592
  • 2
  • 19

I would like to see some data sources for CBSA-level. Until then, I suggest using the following county-level sources and aggregating them to CSBA-level. For this, you can combine cross-walks listed in your link or, possibly more straightforward, use this cross-walk from Jean Roth provided at NBER.

For the county-level, the American FactFinder provides a promising compilation. I found very detailed 2016 data on several of the topics you requested. Two examples:

Comparative Economic Characteristics (Source ID CP03, ACS 1 year survey 2016) enter image description here with, for example, the income distribution as well as mean and median income.

Unemployment (Source ID S2301, ACS 1 year survey 2016) enter image description here with unemployment rates split by age group.