3

I'm interested in analysing the number of COVID-19 deaths reported daily for each country against the total number of deaths daily for the same countries.

There's currently plenty available for COVID-19 related deaths, but for deaths in general I can only find per year.

I'm particularly interested in data for Germany to analyse whether they might be classifying deaths by proximate cause rather than ultimate cause, which would explain the extremely low number of deaths by COVID there compared to their very high number of infections and compared to most other countries.

But even apart from the German data, it would be of interest especially to help illustrate the seriousness of the current situation to skeptics who still don't take COVID-19 seriously.
1
  • 1
    There are some daily time series for deaths but they may not be as up-to-date as the covid19 data.
    – philshem
    Commented Mar 31, 2020 at 8:58

3 Answers 3

4

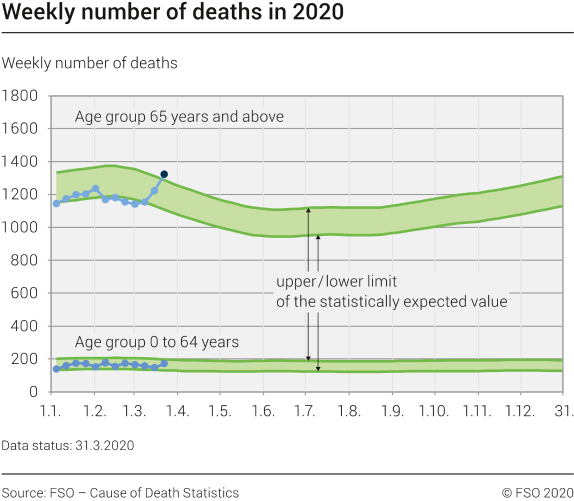
Here is an ongoing effort from Switzerland to get this data, which is published by the Federal Government as a "machine readable" PDF. It's not daily but weekly.

https://github.com/statistikZH/covid19monitoring_health_mortality

weekly deaths by age group

(source: https://www.bfs.admin.ch/bfs/de/home/statistiken/gesundheit/gesundheitszustand/sterblichkeit-todesursachen.assetdetail.12527471.html)

You can find the raw data here (CSVs):

https://github.com/statistikZH/covid19monitoring_health_mortality/tree/master/data

And specifically the 2020 time series (CSV)

https://raw.githubusercontent.com/statistikZH/covid19monitoring_health_mortality/master/data/2020.csv

Update: official csv

https://www.bfs.admin.ch/bfsstatic/dam/assets/12567650/master

2

One way to find out the direct and indirect COVID-19 related deaths is to analyze the excess deaths. It's looking at the excess of deaths compared to what was expected (based on previous years data) per week.

EuroMOMO were among the first to provide some graphs about that.

This article from The Economist is the most exhaustive I have found so far. The data journalist behind the article explains how he calculated the excess deaths in a blog.

A section of this article from the Financial Times also covers it and mentions where they found the different datasets for each countries.

Here are some datasets :

For Germany I think you can download a dataset from destatis.

3
  • Actually my question is about the non-Covid deaths so we can make comparisons since people continue to claim it's just the flu or no worse than the flu or the number of deaths is normal. There are many good sources for Covid deaths, but very few sources for comparing to normal times or comparing to deaths during the Covid crisis but not due to Covid. Commented May 28, 2020 at 7:24
  • 1
    The excess deaths is calculated from the total deaths, not from the COVID-19 reported deaths. So all the datasets I gave are total deaths. The excess death can be compared to COVID-19 reported deaths to measure if the country is reporting all the deaths or is neglecting deaths in care home for instance. In the article of The Economist we can see that Belgium has more COVID-19 reported deaths than excess deaths (102%) because they decided to report any suspicious death even if it has not been tested for COVID-19.
    – JeromeFr
    Commented May 28, 2020 at 7:58
  • 1
    Oh OK sorry for my misunderstanding. I only looked at your answer quickly as I'm working on other things at the moment. Commented May 28, 2020 at 8:00
1

The German statistical office (Statistisches Bundesamt) has published data of deaths per day (for Germany) by age groups (2016 until 5 April 2020).

"Sterbefälle - Fallzahlen nach Tagen, Wochen, Monaten, Altersgruppen und Bundesländern für Deutschland 2016 - 2020".

Find the data here.

Your Answer

By clicking “Post Your Answer”, you agree to our terms of service and acknowledge you have read our privacy policy.

Not the answer you're looking for? Browse other questions tagged or ask your own question.