13

I've downloaded the Central England Temperature Data available from Met Office Hadley Centre. On their summary page, it is described thus (emphasis mine):

These daily and monthly temperatures are representative of a roughly triangular area of the United Kingdom enclosed by Lancashire, London and Bristol. The monthly series, which begins in 1659, is the longest available instrumental record of temperature in the world. The daily series begins in 1772. Manley (1953, 1974) compiled most of the monthly series, covering 1659 to 1973. These data were updated to 1991 by Parker et al (1992), who also calculated the daily series. Both series are now kept up to date by the Climate Data Monitoring section of the Hadley Centre, Met Office. Since 1974 the data have been adjusted to allow for urban warming.

The data comes in a nicely compact but not immediately processable format:

    Column 1: year
    Column 2: day
    Columns 3-14: daily CET values expressed in tenths of a degree. There are 12 columns; one for each of the 12 months.
     1772    1   32  -15   18   25   87  128  187  177  105  111   78  112
     1772    2   20    7   28   38   77  138  154  158  143  150   85   62
     1772    3   27   15   36   33   84  170  139  153  113  124   83   60
     1772    4   27  -25   61   58   96   90  151  160  173  114   60   47
     1772    5   15   -5   68   69  133  146  179  170  173  116   83   50
     1772    6   22  -45   51   77  113  105  175  198  160  134  134   42

(The description doesn't to mention that not available / applicable data is encoded as -999.)

I've processed this in to a 3.8 Meg CSV file that provides columns for both unix time and iso8601, then columns for min, mean and max daily temperature. Temperatures are in centigrade. Rows are in time order.

Here's my ruby code for doing that:

#!/Users/benjohn/.rvm/rubies/ruby-2.1.0/bin/ruby
require 'time'

def with_time_and_temp(data_file)
  File.readlines(data_file).each do |line|
    line = line.split
    year = line[0]
    day = line[1]
    1.upto 12 do |month|
      miligrade = line[1+month].to_i
      unless(miligrade == -999)
        time = Time.gm(year, month, day)
        temp = miligrade / 10.0
        yield(time, temp)
      end
    end
  end
end

time_to_temps = Hash.new {|h,k| h[k] = Array.new(ARGV.count)}

(0...ARGV.count()).each do |i|
  with_time_and_temp(ARGV[i]) do |time, temp|
    time_to_temps[time][i] = temp
  end
end

puts "unix-time,iso8601,#{ARGV.join(",")}"
time_to_temps.to_a().sort().each do |record|
  puts("#{record[0].to_i},#{record[0].iso8601},#{record[1..-1].join(",")}")
end

Here're the first few lines of the output file:

    unix-time,iso8601,cetmindly1878on_urbadj4.dat,cetdl1772on.dat,cetmaxdly1878on_urbadj4.dat
    -6248275200,1772-01-01T00:00:00Z,,3.2,
    -6248188800,1772-01-02T00:00:00Z,,2.0,
    -6248102400,1772-01-03T00:00:00Z,,2.7,
    -6248016000,1772-01-04T00:00:00Z,,2.7,
    -6247929600,1772-01-05T00:00:00Z,,1.5,
    -6247843200,1772-01-06T00:00:00Z,,2.2,
    -6247756800,1772-01-07T00:00:00Z,,2.5,
    -6247670400,1772-01-08T00:00:00Z,,0.0,
    -6247584000,1772-01-09T00:00:00Z,,0.0,

(Note that for the earlier dates the min and max are not available).

I would like to share this data more effectively than sticking it in my drop box. Is there some kind of repository for this sort of thing?

I would also like to process and graph this data. In particular, I would like to try and see how "extreme events" are distributed.

I am a total beginner with visualisation and processing but experienced as a programmer. I'm pretty sure that I could write some scripts, or use SQLite for processing, and get a graphing application from somewhere… but, I wonder if there are some friendly and accessible tools I should be using in this web 2.0 world of 2014?

I'm on a Mac computer, if that's relevant.

Thanks!
2
  • I'm not a climate scientist, but I would think that to define 'extreme event', you'd need to know how it vares from the norm ... which is more complicated when you've got a cyclic value on a yearly scale, possibly with other larger scale trends. So that -4.5°C temp might be normal for January, but extreme if it were in August.
    – Joe
    Commented Feb 17, 2014 at 3:33
  • @joe I'm not either, nor much of a statistician (yet) :-) I think one could get very sophisticated, as you say, but my initial take is going to be to simply rank the whole data set in order of temperature, and then look at how the outliers (top & bottom 0.1%, say) distribute through the data. I'd like to see if the distribution seems to deviate statistically from the fairly uniform distribution one would expect. I've no idea if I'll find anything, but it'll surely be a learning experience to try it out.
    – Benjohn
    Commented Feb 17, 2014 at 14:08

3 Answers 3

14

Data

Here is my take on it: I use R and its IDE RStudio.

The hard part, cleaning the data, is luckily done. Sharing the CSV via a dropbox link is not bad. The file is well structured. To improve it you could add a licence and provide a bit more information about the source. For more information see our certificates.

If you want to publish in a more "professional" way, you can use a platform such as Socrata or datahub.

Analysis

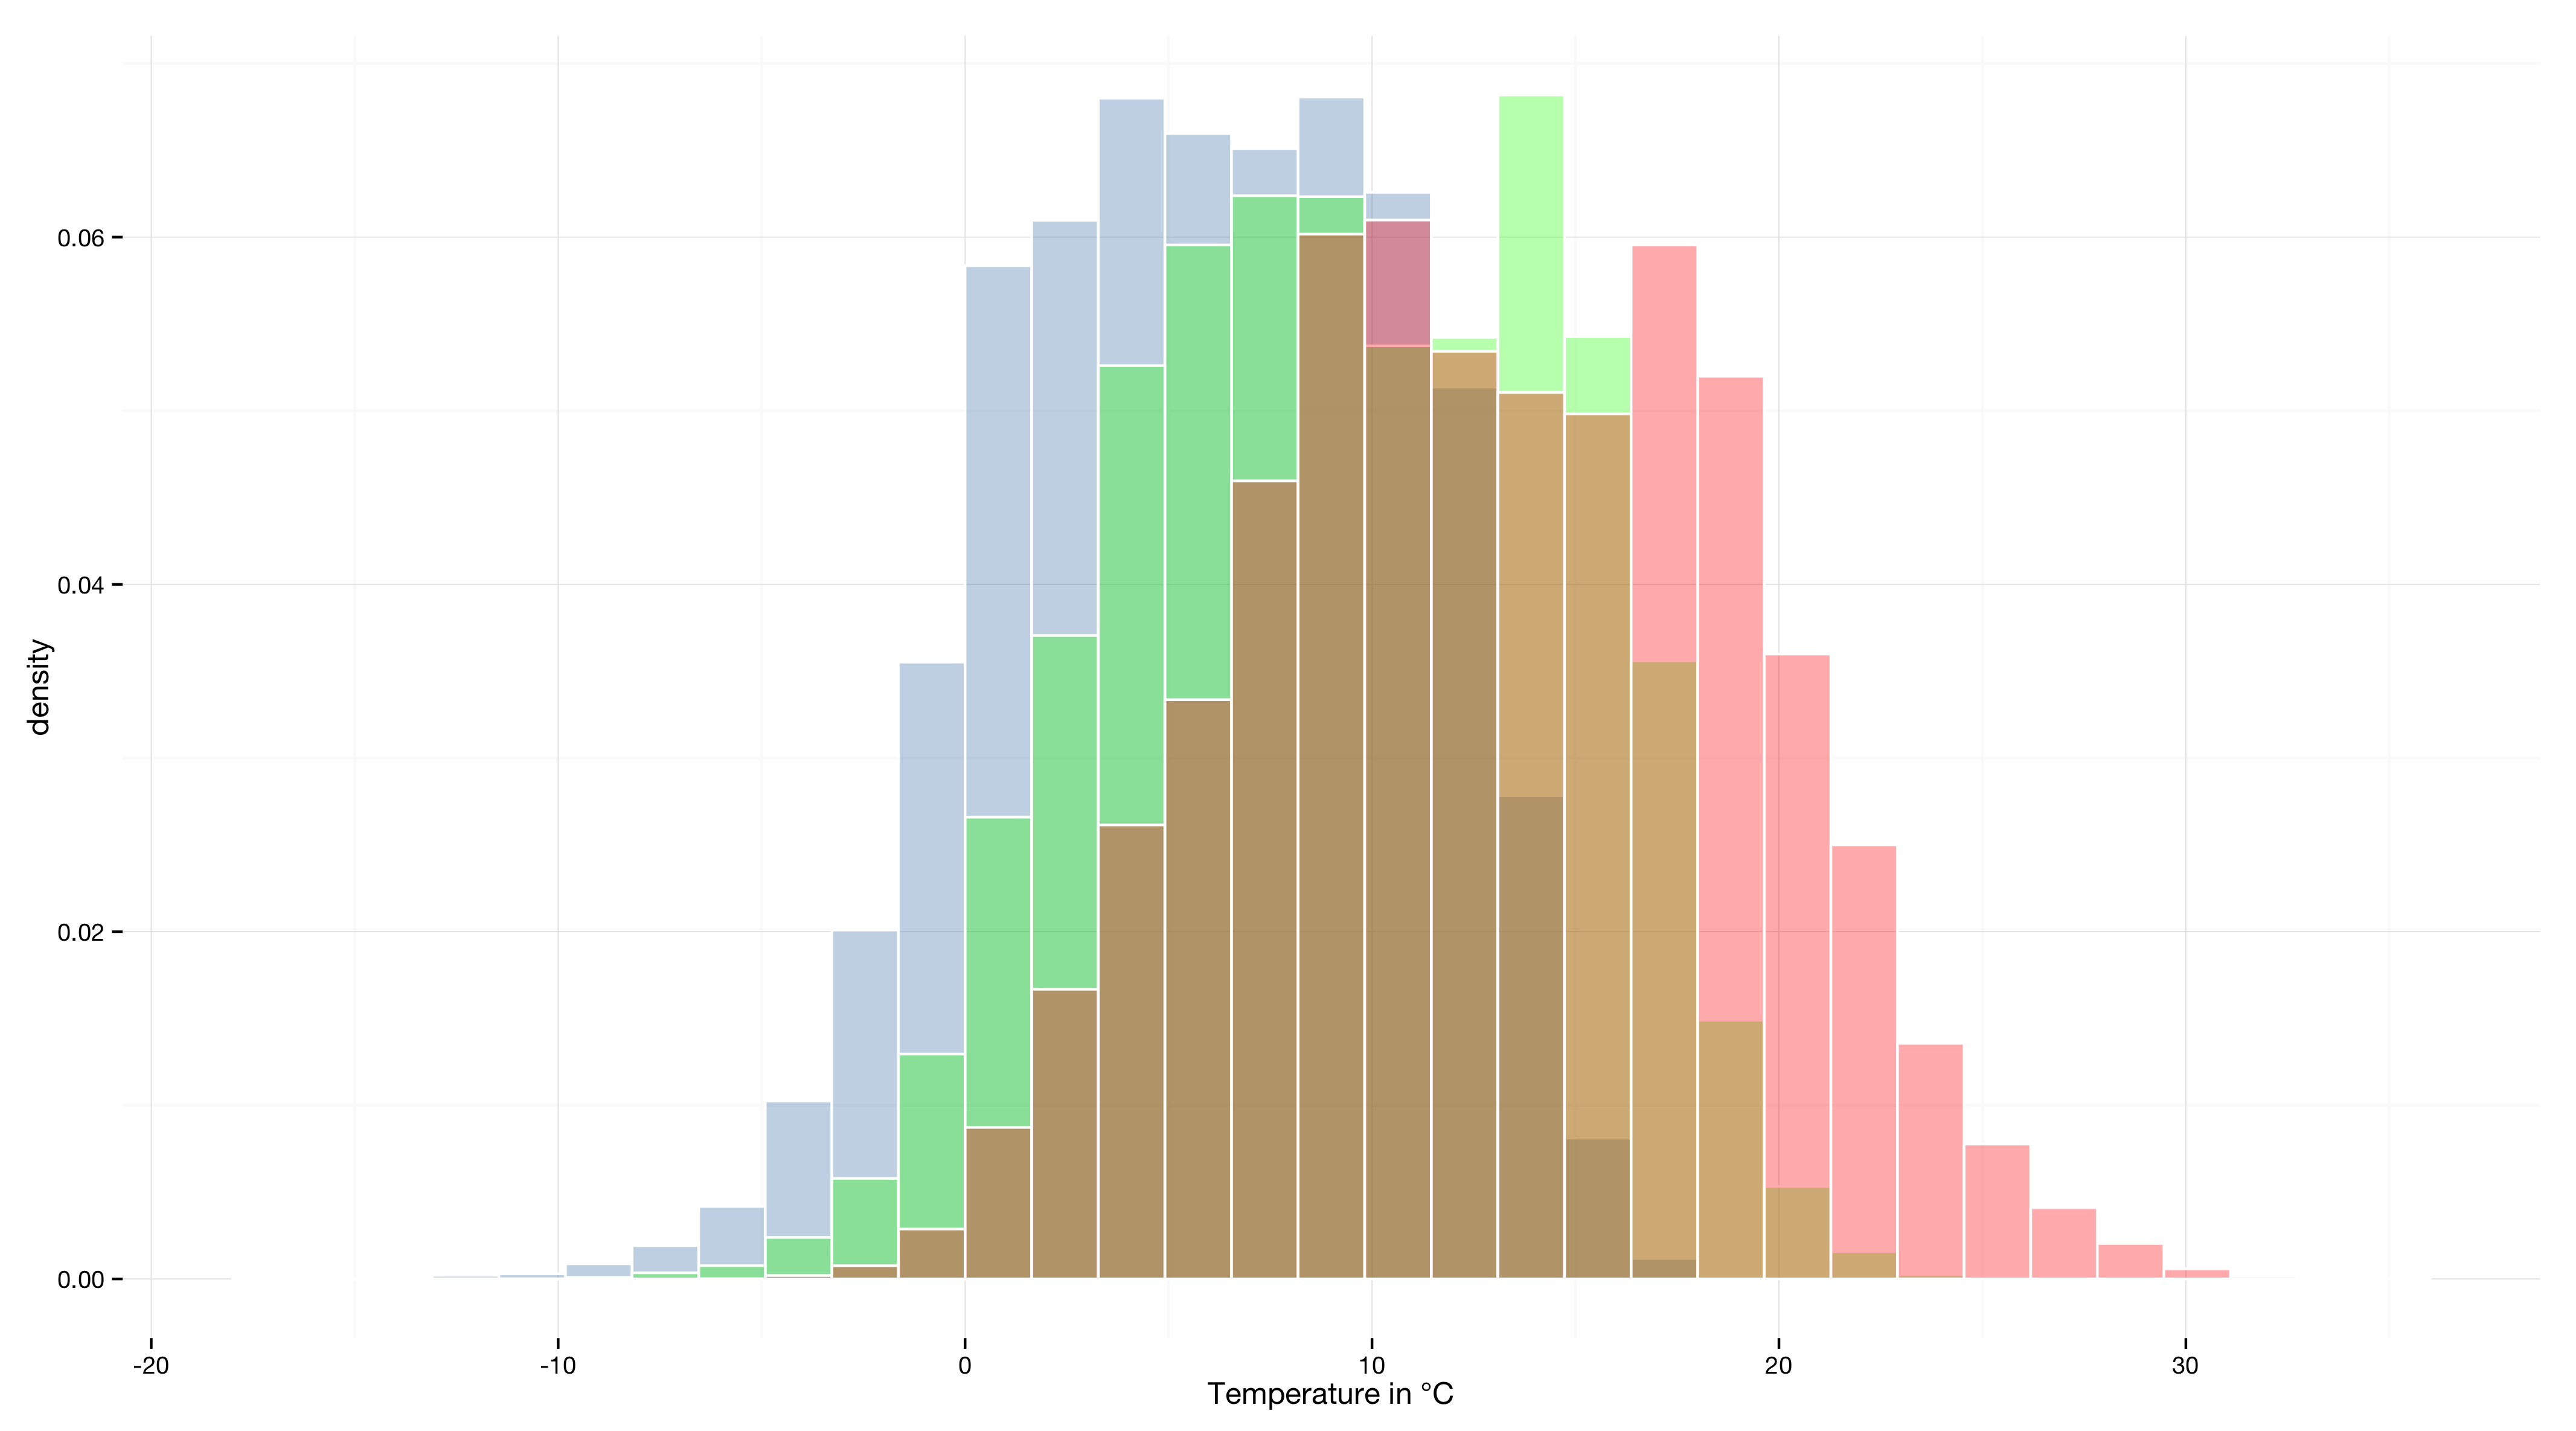
Use the power of visualisation to get a sense of the data. For example, three histograms across all years.

histogram

Then I would calculate summary statistics for groups such as years or months. That should inform you about outliers.

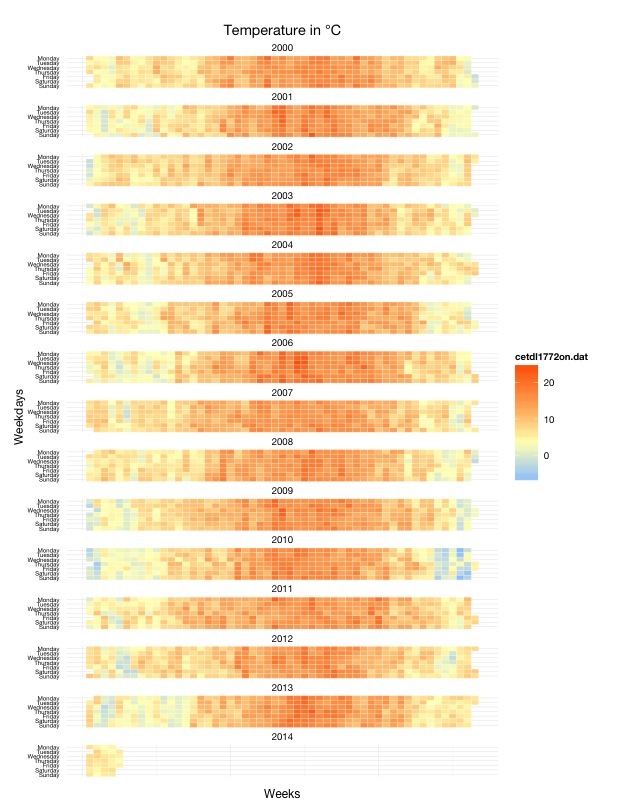
We can also look at a calendar visualisation.

enter image description here

The winter in 2010 seems to be particularly cold. Winter is coming...

Now that you have a sense of the data, you can explore ideas of how to create an algorithm that finds interesting patterns and outliers.

Code

I have run similar analyses before therefore I have some code that I was able to re-use. We share all of our code on GitHub. The relevant repository is here: https://github.com/theodi/R-playground/tree/master/weather-centuries

This is the syntax file for the graphics. (Note that calendarHeat.R is from Paul Bleicher.)

4
  • 1
    Thank you (voted up), that's pretty awesome already! I'll look at your link suggestions. I'm hoping to persuade the Met Office Hadley Centre to host a more accessible version of the file… :-) I would be extremely intrigued if there was a structure visible in the weekdays :-)
    – Benjohn
    Commented Feb 17, 2014 at 14:17
  • Oh, I can't vote up your answer – not enough reputation yet!
    – Benjohn
    Commented Feb 17, 2014 at 14:17
  • I upvoted for you (and me).
    – philshem
    Commented Feb 17, 2014 at 14:45
  • @philshem Thanks. But hey, if you up vote my question, I'll have enough reputation to up vote this answer too ;-)
    – Benjohn
    Commented Feb 17, 2014 at 20:18
3

There has been a bunch of statistical work in this area (spatio-temporal modeling and extreme value theory); there have been several programs at SAMSI that have generated good peer reviewed papers ( http://www.samsi.info/workshop/birs-extreme-events-climate-and-weather-interdisciplinary-workshop-10w5016-0 )

One statistical approach might go like this:

  • Setup a change of support problem to interpolate the values in between the grid (you may have to look at some modern data to get a correlation structure). Then you can make contours/heatmaps that are statistically rigorous

  • at that point, you can create gridded temperature estimates by time unit. You can then make a movie by putting the values in time order

  • along the bottom, you might want to show the time series for some key points

  • there will almost certainly be a decent time series model (in a number of approaches, univariate, multivariate); you might be interested in the values that are the biggest departures from the expected trends. You might be interested in the absolute biggest/smallest values as well

Some references:

1

you can use heatmap.js with leaflet.js, although you may need to convert the csv, which is probably opposite your question
http://www.patrick-wied.at/static/heatmapjs/example-heatmap-leaflet.html
you could use d3.js to make histograms:
http://bl.ocks.org/mbostock/3202354

Your Answer

By clicking “Post Your Answer”, you agree to our terms of service and acknowledge you have read our privacy policy.

Not the answer you're looking for? Browse other questions tagged or ask your own question.